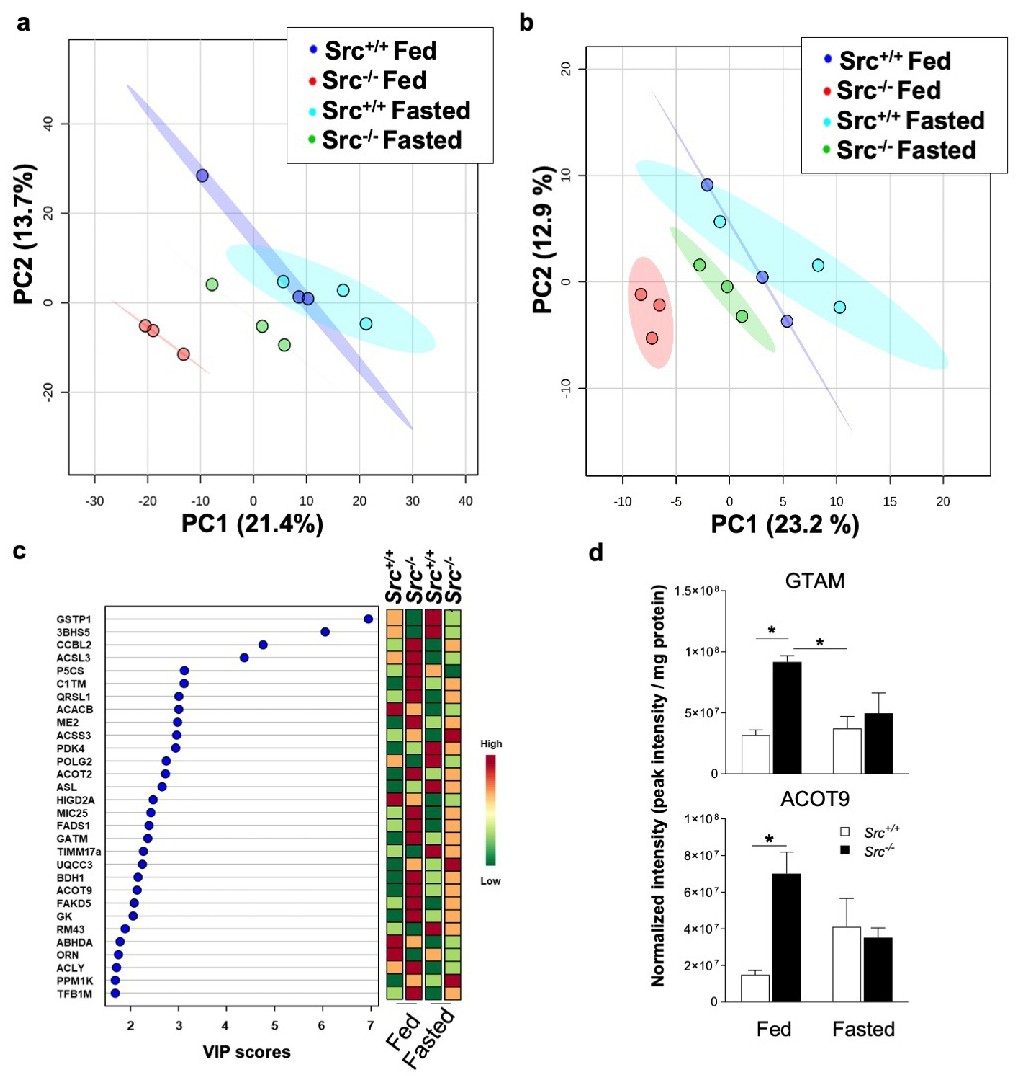
Fig. 4. The impact of Src on liver proteome according to nutrient availability. (a, b) PLS-DA plots showing different proteomic signatures for Src+/+ and Src-/- mice fed ad libitum or fasted considering all proteins (a) or only mitochondrial proteins (b) detected by nanoLC-MS/MS. Ellipses represent 95 % confidence intervals for each individual group on PLS-DA plots with the variance proportion represented by principal components 1 and 2 (PC1 & PC2, respectively). (c) Variable importance of projection (VIP) scores of PLS-DA, identifying the key proteins driving the proteomic signatures for fed and fasted Src+/+ and Src-/- mice. (d) Quantitative analysis of proteins (with VIP score ≥ 2) driving the proteomic signature of Src+/+ and Src-/- mice fed ad libitum or fasted. See also Fig. S3 for key proteins that are not significantly different among experimental groups. Data are mean ± SEM (n = 3). *p<0.05 determined by a two-way ANOVA followed by post-hoc Tukey's test.